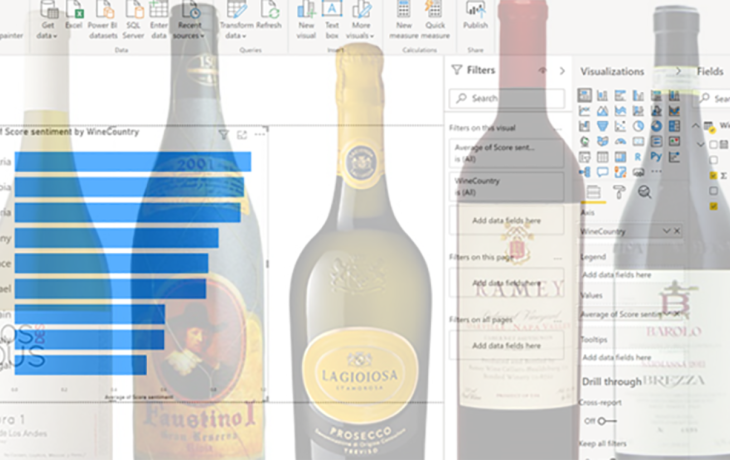
- Sentiment Analysis in Power BI, analyse text reviews and a Premium tip.14th July 2020Power BI is great at analysing numeric data. Numbers like values, costs, stock holdings and averages can all be worked up into informative charts and visualisations. But what if your data isn’t like that? What if your data is more textual, like...
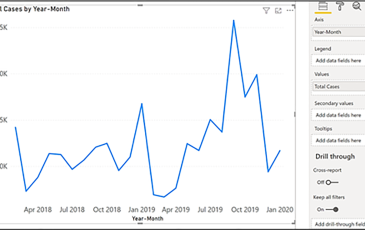
- 7 Secrets of the Line Chart10th July 2020The line chart is the go-to chart type to visualise data over time. Typically, this visual is used to analyse your data by year, quarter, month or by...
- All our courses are now available as Live Online Training29th April 2020All our Courses are now available as “ Live Online Training“, here’s what you need to know. In a “Social Distancing” world we can’t gather together in...
- Live Online Power BI Training from Burningsuit8th April 2020We have many years’ experience of training people how to use Microsoft Power BI. Up to now our training has all been face-to-face, either as open...
- Power BI Conditional Formatting16th March 2020I thought this would be an easy blog. Not much to say about using Power BI’s Conditional Formatting. All it does is make visuals look more appealing...
- Why Power BI Training Courses in London Could Benefit You12th March 2020Power BI is an essential tool that many businesses use to get insightful reports on a range of different important metrics. Whilst it’s extremely...
- Enable the new Ribbon Menu in Power BI Desktop18th February 2020I’ve made a quick video to show how you can enable the new Ribbon Menu in Power BI Desktop. In the February 2020 version of Power BI Desktop this is...


