
Archive
7 secrets of the matrix visual
This post has dated update notes where Power BI has changed since it was written.
Update notes are by Alan Harman-Box.
Some of you Excel users may have realised that the Power BI Matrix visual is just an Excel Pivot Table by another term. You even get buckets for "Rows", "Columns" and "Values" just like constructing an Excel Pivot Table.
The temptation is to think this is all the Matrix visual can do; act like, well, a typical Pivot Table: -
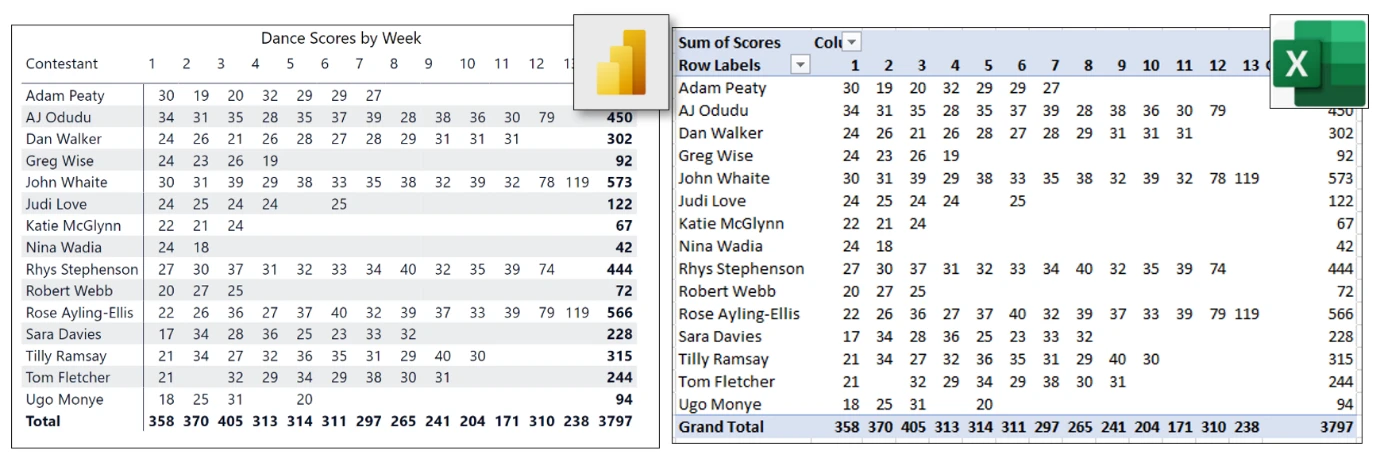
You can see that both the Matrix and the Pivot Table have the Contestant field in "Rows" and the Week field in "Columns", showing Contestants' dance scores (in "Values") for each week, along with the grand total for each Contestant and each Week.
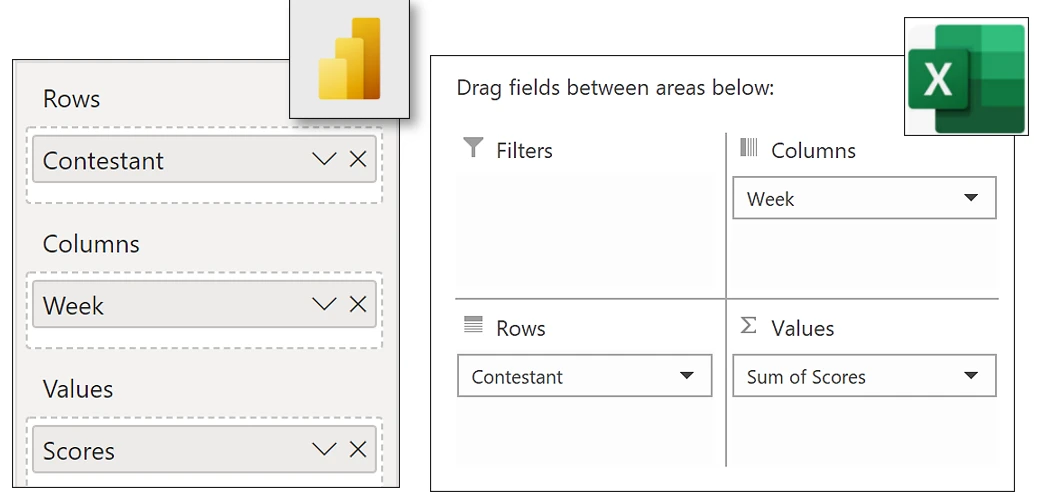
However, depending on your knowledge of Excel Pivot tables, you'll know that if the Matrix is just like an Excel Pivot Table, then you should be able to do a lot more than just show a "matrix" of data. The trouble is that unlike the Excel Pivot Table, where all the options are readily at hand on the Excel Ribbon, most of the Matrix options are so hidden away they could be described as "secrets".
With this in mind, here are my seven favourite Matrix secrets.
Secret No.1 - Grand Totals are really Subtotals.
In an Excel Pivot Table, grand totals are easily removed. Just use the button on the Ribbon labelled "Grand Totals".
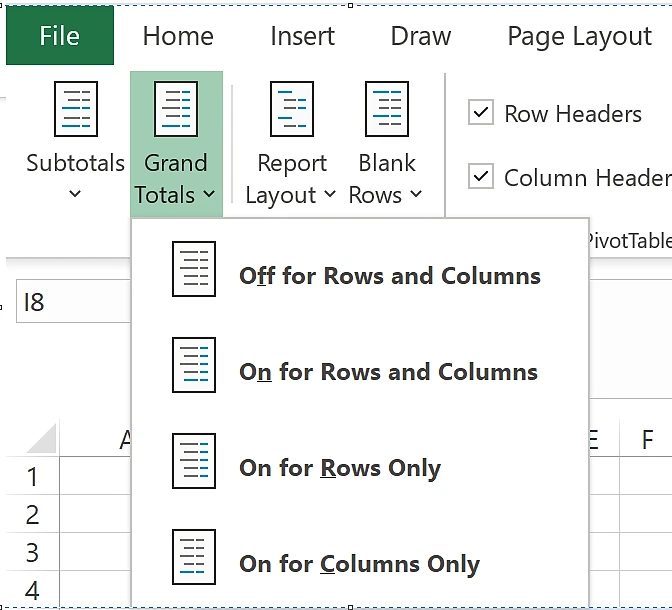
In a Power BI Matrix, you might think you'd be able to do the same thing on the Column grand totals or Row grand totals cards, but you won't see any option to turn them off. You just get options to format the grand totals.
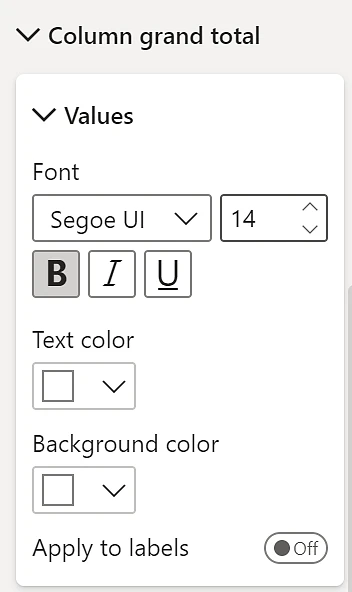
This is what I mean by "secretive". Where is the option to turn off the grand totals hidden?
Well, one thing you must understand is that in a Power BI Matrix, grand totals are really subtotals! So, to turn grand totals off, turn off the Column or Row subtotals.
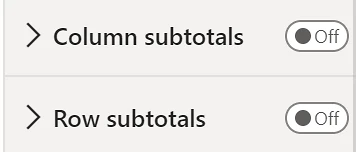
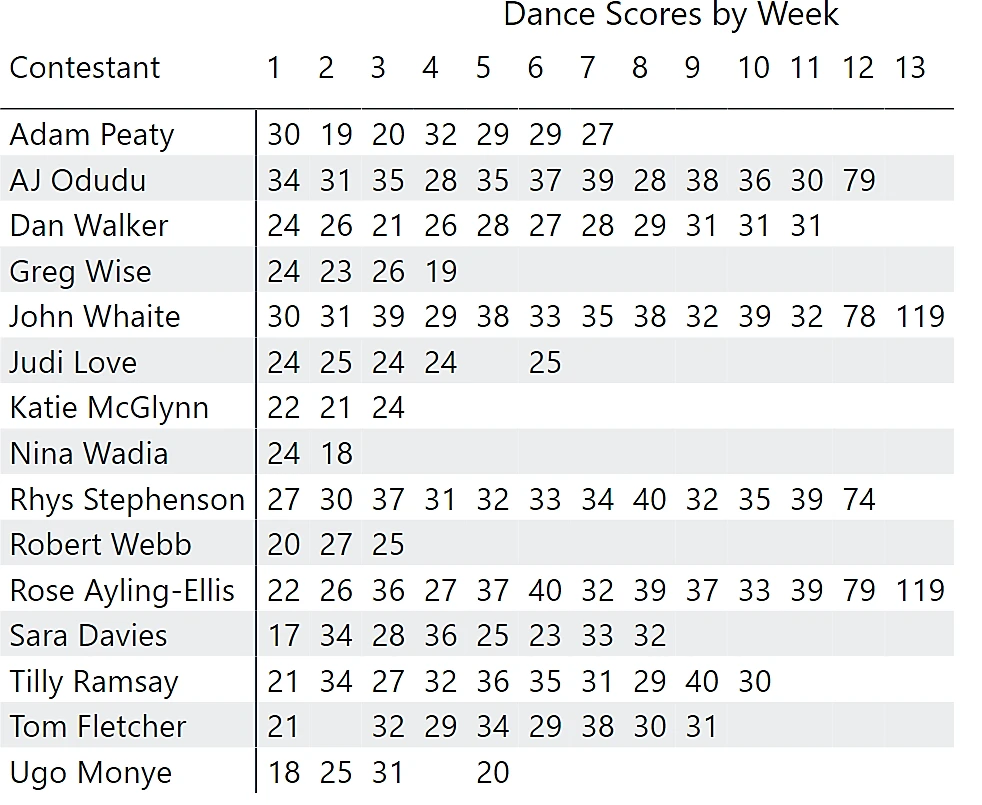
However, be warned; if you have multiple fields in the Rows bucket, this will also remove all your subtotals, not just the grand total. To remove only the grand total while retaining other subtotals, you'll need to uncover another secret, see Secret No.4 below.
Secret No.2 - Expanding all down one level in the hierarchy.
The starting point to understanding this secret is to appreciate that it's not until you work with multiple fields in the "Rows" bucket that your Matrix can become more informative. You'll see on the right that I now have both Contestant and Professional in Rows.
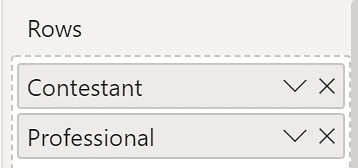
Unfortunately, when you put a second field into Rows, it may appear that nothing much has happened; secretive or what! However, you'll notice a series of arrows at the top right (or bottom right) of the visual and there is one label "Expand all down one level in the hierarchy". Apparently, this is what you need to click on to see the second row.
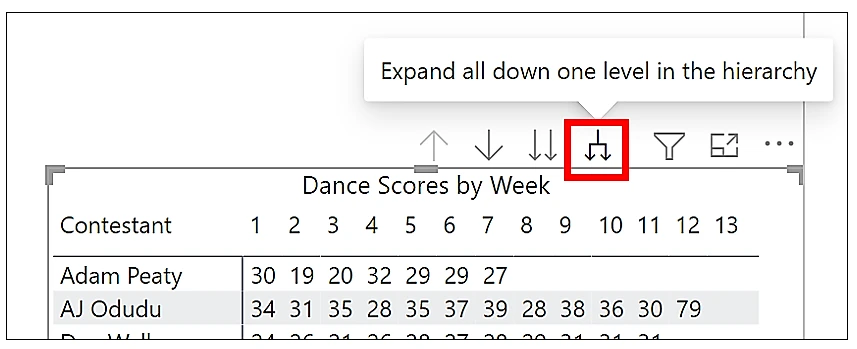
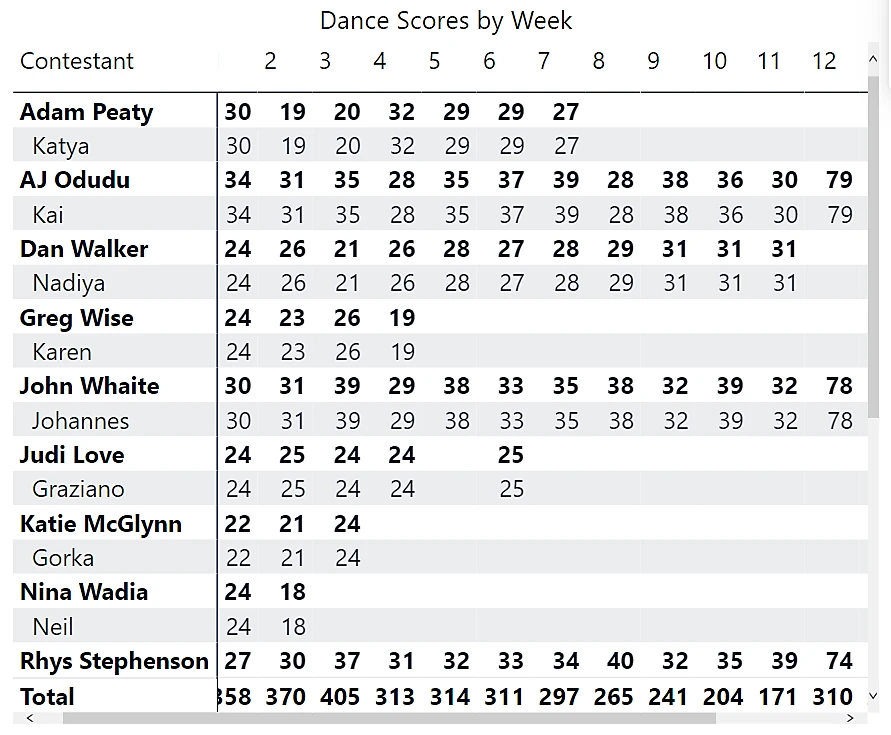
Looking at the Matrix now however, it's not exactly what I want. The Professional's names are indented under each Contestant's name when they really should be sitting beside each other, and because there is only one Professional for each Contestant, I get irrelevant subtotals on the Contestant rows (in bold). More secrets need revealing!
Secret No.3 – Turn off "Stepped layout".
With most Matrices, the indented or "Stepped" layout gives less clarity to which rows the values refer to (this is the equivalent to "Compact layout" of the Excel Pivot Table). It's better to put each Row label in a separate column. To do this, just turn off "Stepped layout" on the Row headers card.
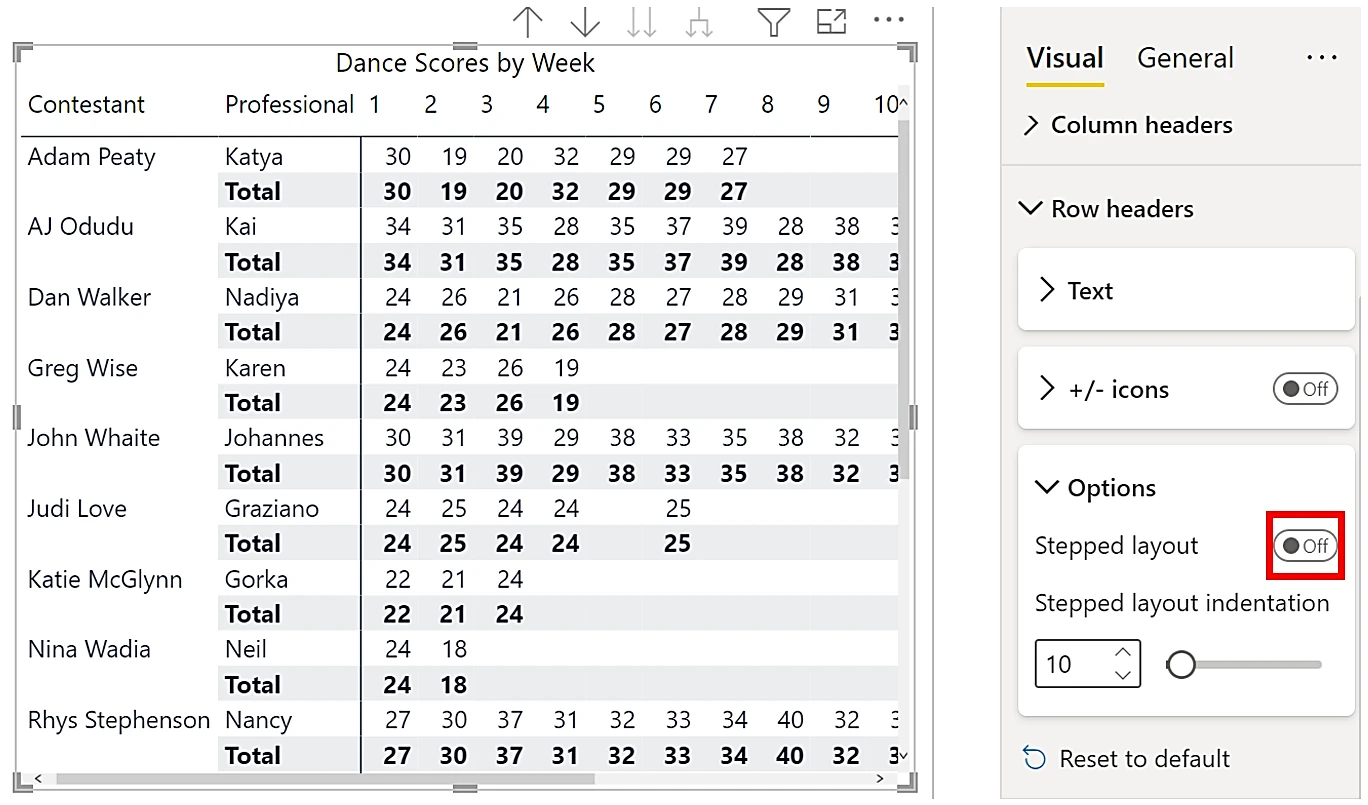
Update, November 2026: Power BI no longer has a Stepped layout switch. In the format pane, go to Layout, then Matrix layout, and choose Tabular to put each row field in its own column with no indentation. Compact is the indented layout, and Outline also gives each field its own column but shows subtotals at the top of each group.
This is definitely an improvement, but I still see those subtotals and they've now moved to a row of their own, labelled "Total". I can turn off the Row subtotals on the Row subtotals card (as explained in Secret No. 1 above) and now I just have subtotals for each Contestant, not each week.
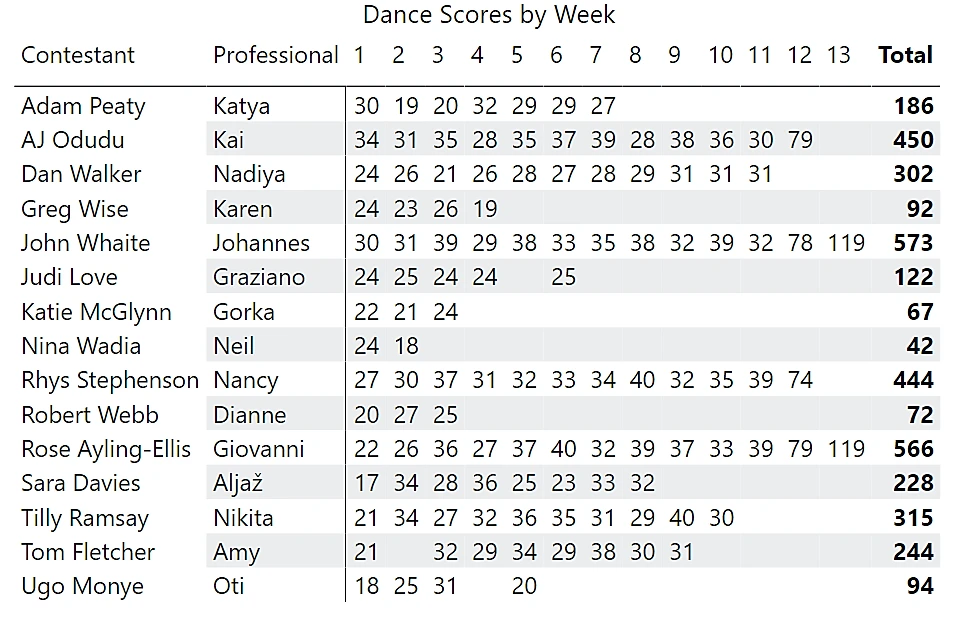
Secret No.4 - Only show the subtotals/grand totals you want to see.
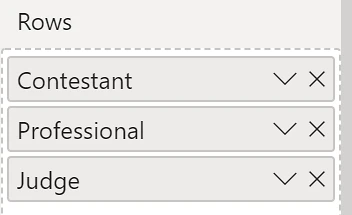
However, if I add a third field to the Rows bucket e.g. for the Judges (I also need to expand down all one level in the hierarchy again) and turn Row subtotals on again, things become a little more challenging. I get subtotals for both Professionals and Judges, showing the same values, as well as grand totals for all the Contestants for each week at the very bottom of the matrix.
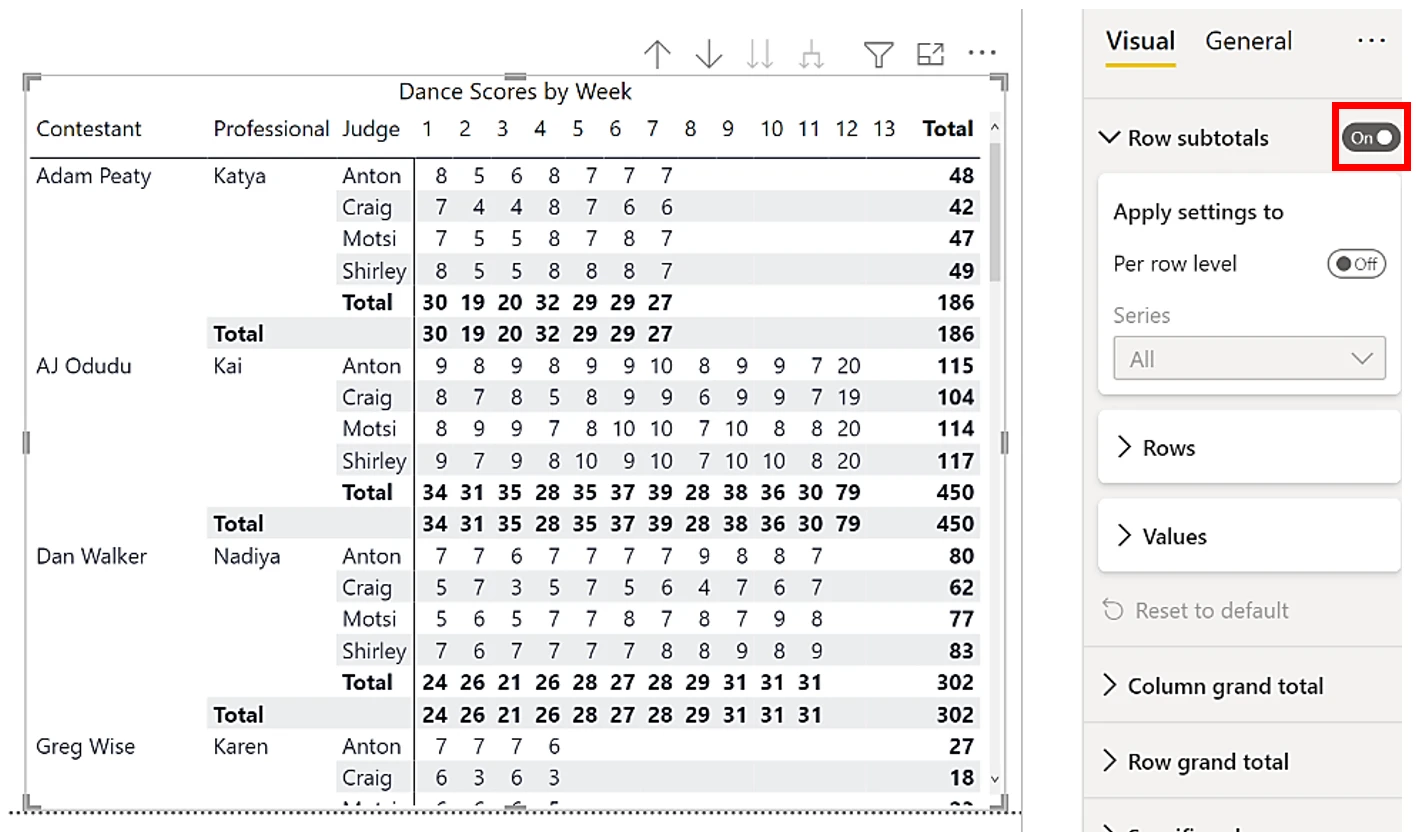
Before I control which subtotals show however, I can take the opportunity of formatting the subtotals by using the "Values" card. Don't forget that if you want the grand totals formatted differently from the subtotals, use the Row grand totals card as shown in Secret No.1 above.
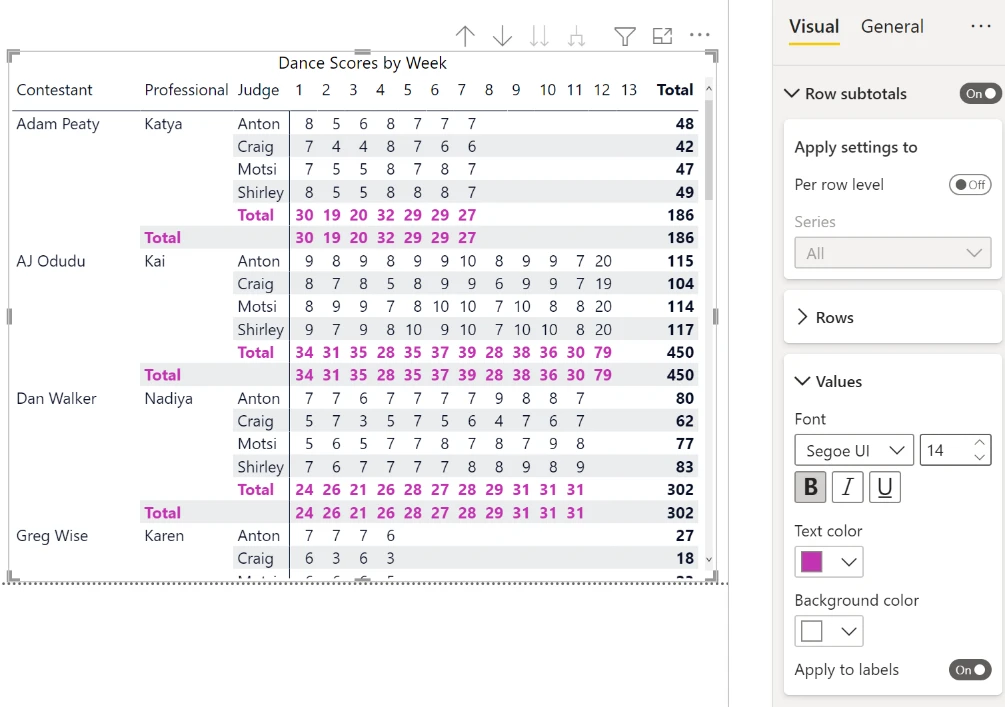
I want to remove the subtotals only for the Professionals. So how do I control which subtotals and/or grand totals to show? This secret is really hidden away where no one can find it!
On the Row subtotals card, turn on "Apply settings to Per Row Level". By default, subtotals show for all series, so you need to select the Series whose subtotals you want to remove. Then on the Rows card, turn the subtotals off for that series. I want to remove the subtotals for the Professional series.
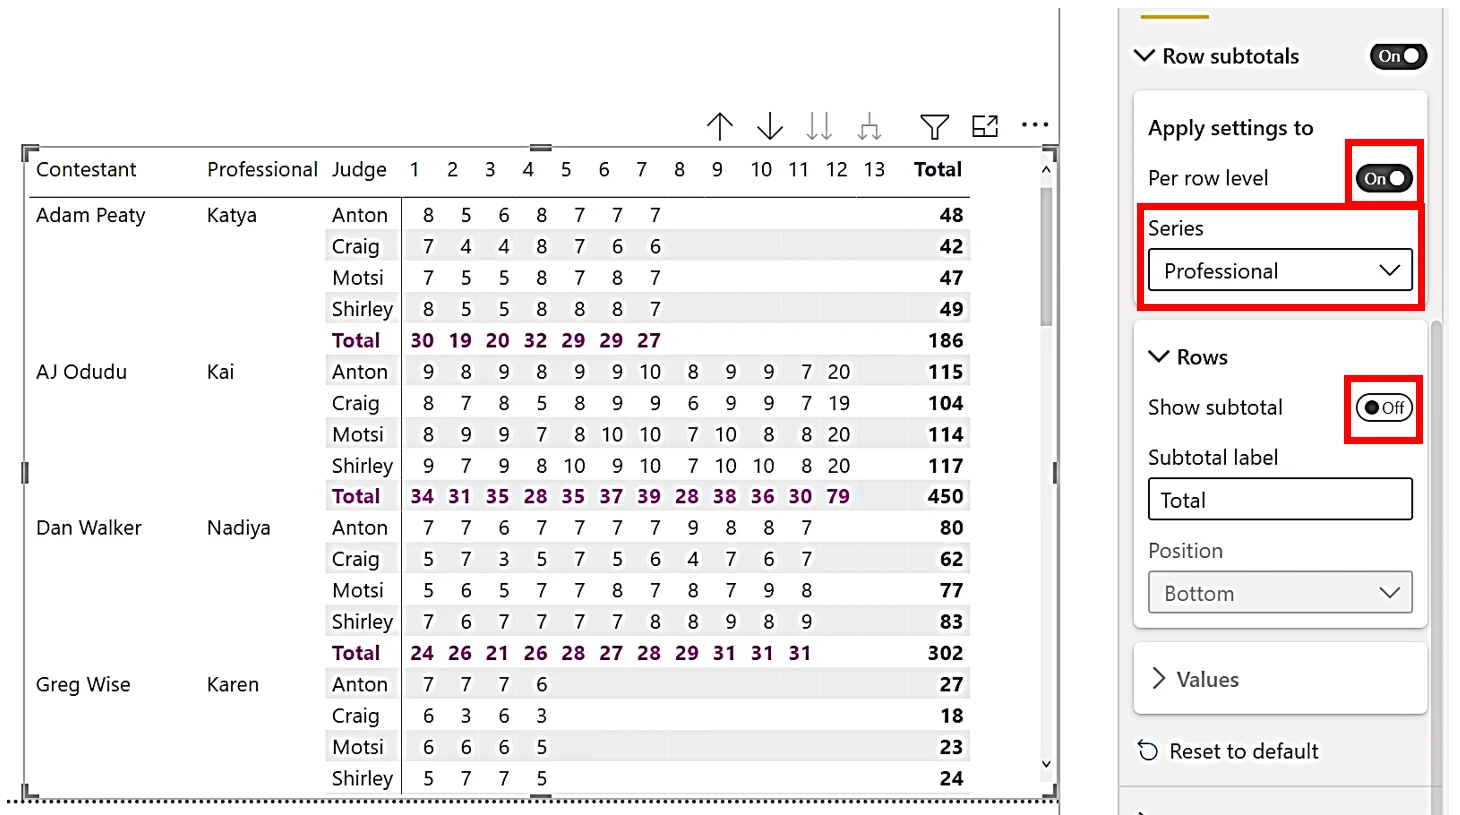
Update, November 2026: Power BI now labels this dropdown Row level, where the text and screenshots say Series. It is under Row subtotals, Apply settings to, Per row level.
Note that if you want to remove grand totals, these are the subtotals associated with the first field listed in the Series dropdown e.g. Contestant, in my case.
Also note that the Values card is enabled only if "All" is selected in the Series dropdown. You don't seem to be able to format different subtotals separately (except for the grand totals). You can click on "Revert to default" at the bottom of the Row subtotals card to enable the Values card.
Secret No.5 – Show Values on Rows
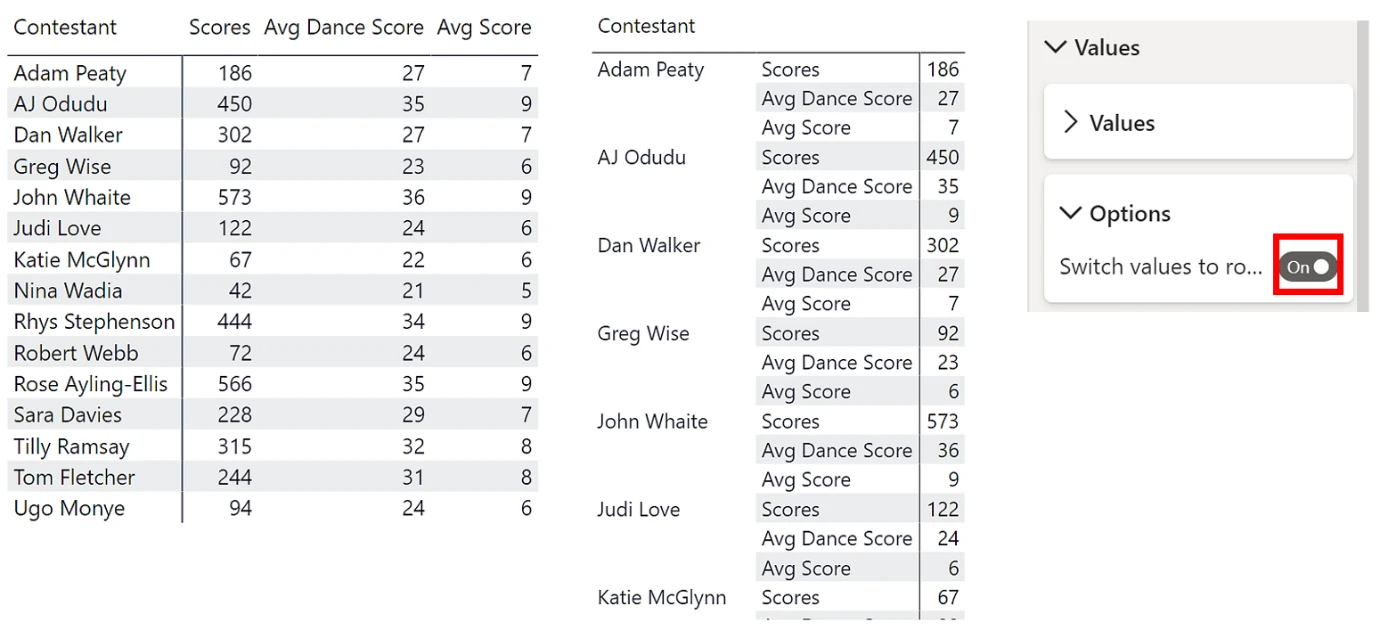
Ever wanted to do this? Compare the two Matrix visuals below. On the left, the Values are in columns, which is the default. On the right, the values have been placed in the Rows. This is a well-known secret, but you can use the Values card (under the Grid card) and then expand the Options card, turning on "Switch values to rows"
Secret No.6 – Show text in the Values area
Ever wanted to put the names or descriptions into the values area of the Matrix, as in the example below. You can see that in Rows is Contestant name, in Columns is the Week and the Values area is populated with the names of the dances performed.
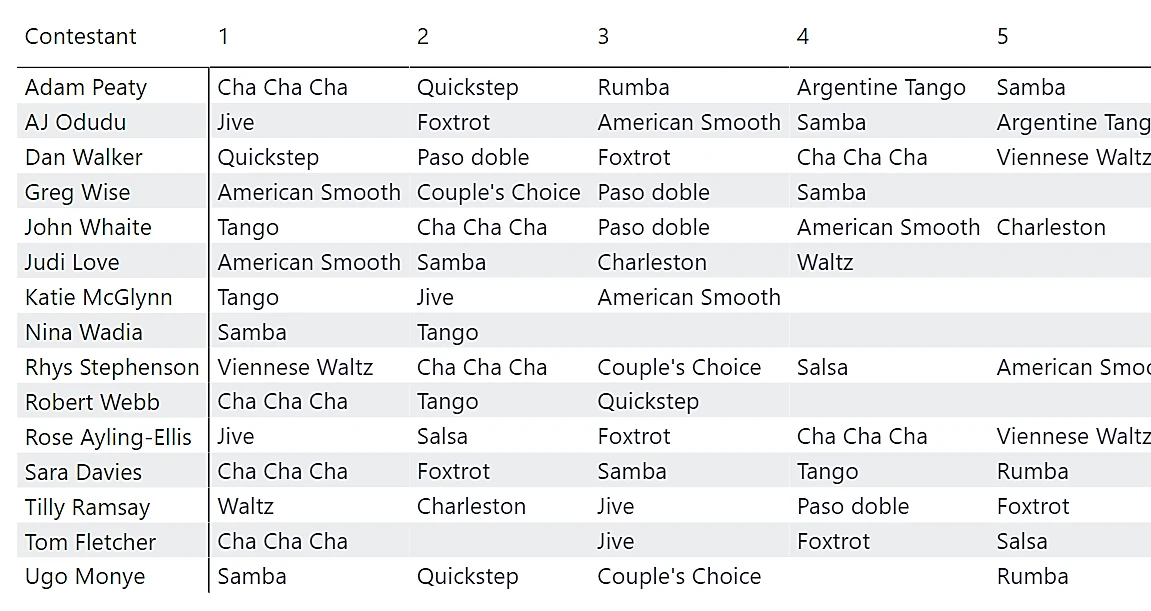
In the Values bucket of the Matrix, I have placed a DAX measure, "Dance Name"
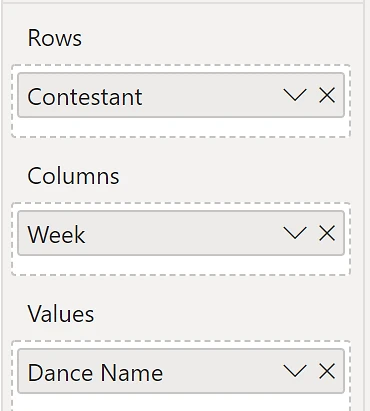
This is the DAX for the "Dance Name" measure: -
Dance Name = SELECTEDVALUE(Dances[Dance])
In the brackets of the SELECTEDVALUE function, put the column name of the column you want to put in the middle of your Matrix (in our case the Dance column from the Dances table) and use this measure in the Values bucket. However, this measure can only show values if there is only one value to show e.g. each contestant performs only one dance in each week.
Secret No.7 – Use Conditional Formatting,
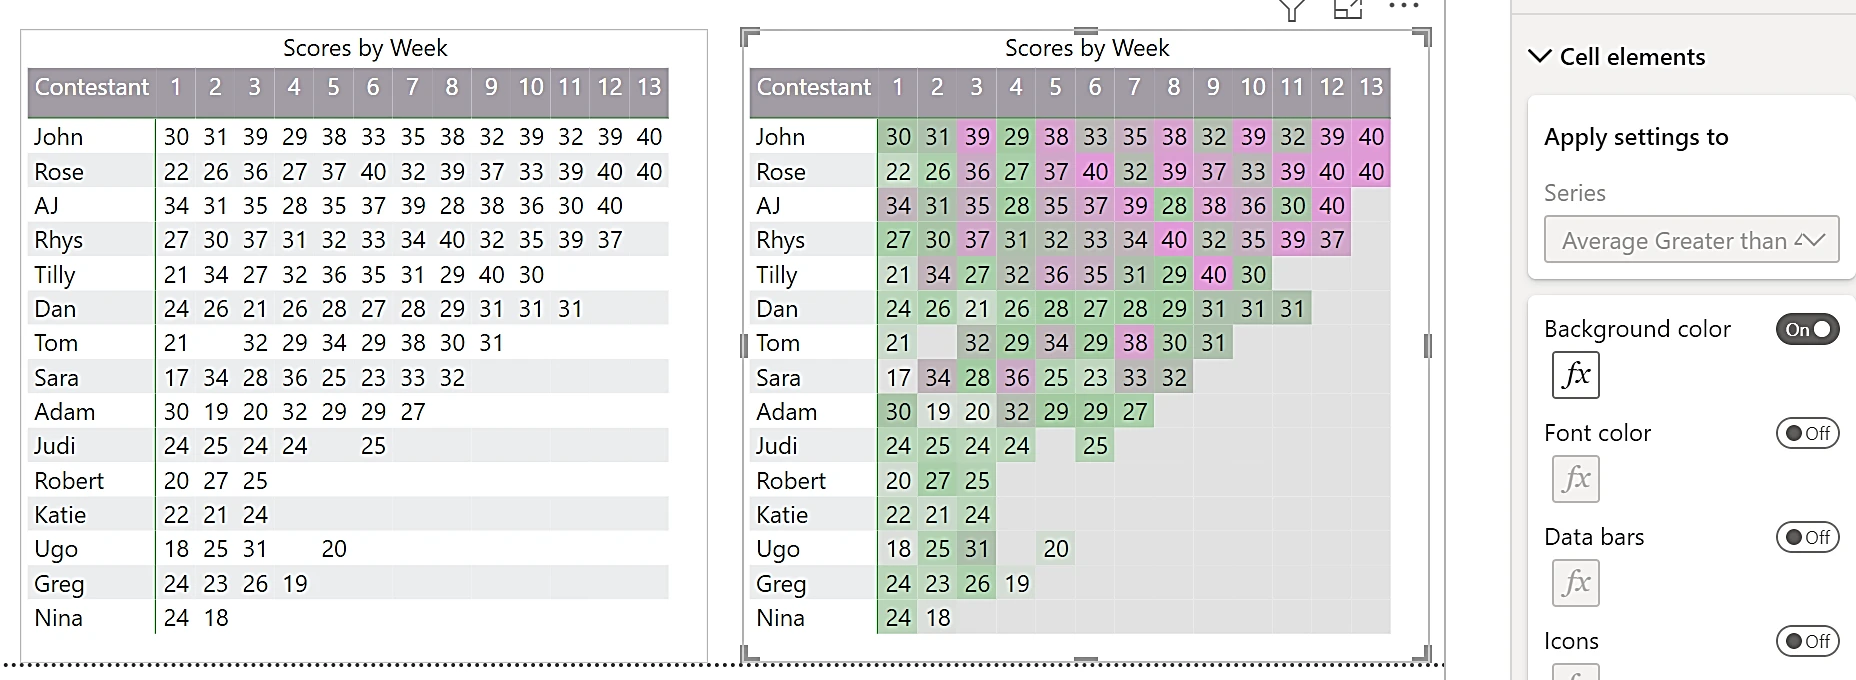
Compare the two visuals below. See how much more appealing and informative the one on the right is than the one on the left. Just using a simple background color on the Cell elements card brings the visual to life.
Related: The 8th secret of the matrix visual (October 2020).
If you build reports and want to write the measures behind them, DAX fundamentals is where to start. Every course is on Training.